
My career clock is ticking. Before I leave the profession (in under 3 months!), I want to find answers to nagging questions. Can my students audiate and identify tonalities in pieces they’ve never heard before — not merely the tonalities of various series of patterns, or teacher-composed songs, or even great folk songs like “Go Down Moses”? Can students transfer their tonal audiation skills? Can they identify the tonality of complex, multifaceted works that, we hope, they’ll encounter later in life?
To answer these questions, I re-administered (and then re-wrote) my Tonality Test. You can find this revised version at the bottom of this post.
_________________________________________________________________________________________
Some Details About the Tonality Pre-Test Results
Back in September and October of 2023 — after students had heard and sung many songs and tonal patterns in major and minor, but before they had sung patterns in various series — they took the test as a pre-test. (You can find details about that original version here.) The most important descriptive statistic is that the obtained mean of 19.18 was very close to the chance score of 20 — exactly where I wanted it to be. The pre-test, in other words, did its job: It showed me that my students had no clue how to aurally discriminate between major and minor tonalities.
Back then, I wrote the following year-long goal:
Throughout the year, I’ll teach my tonal audiation exercises; then I’ll administer the test again; and finally I’ll revise it by removing the lousy items, those with poor discrimination values. I’ll also remove many of the 18th century items, especially most of the Handel excerpts, which I love, but seem to me now to be too much of a good thing.
Did things turn out that way? Keep reading to find out.
_________________________________________________________________________________________
Tonality Post-Test: Descriptive Statistics
During the third week in March, 2024, students (n = 172) in 4th, 5th, and 6th grades at the Stephen Decatur School in Philadelphia took the Tonality Test as a post-test.
Students filled in their answers using a google form shown, in part, in Figure 1.
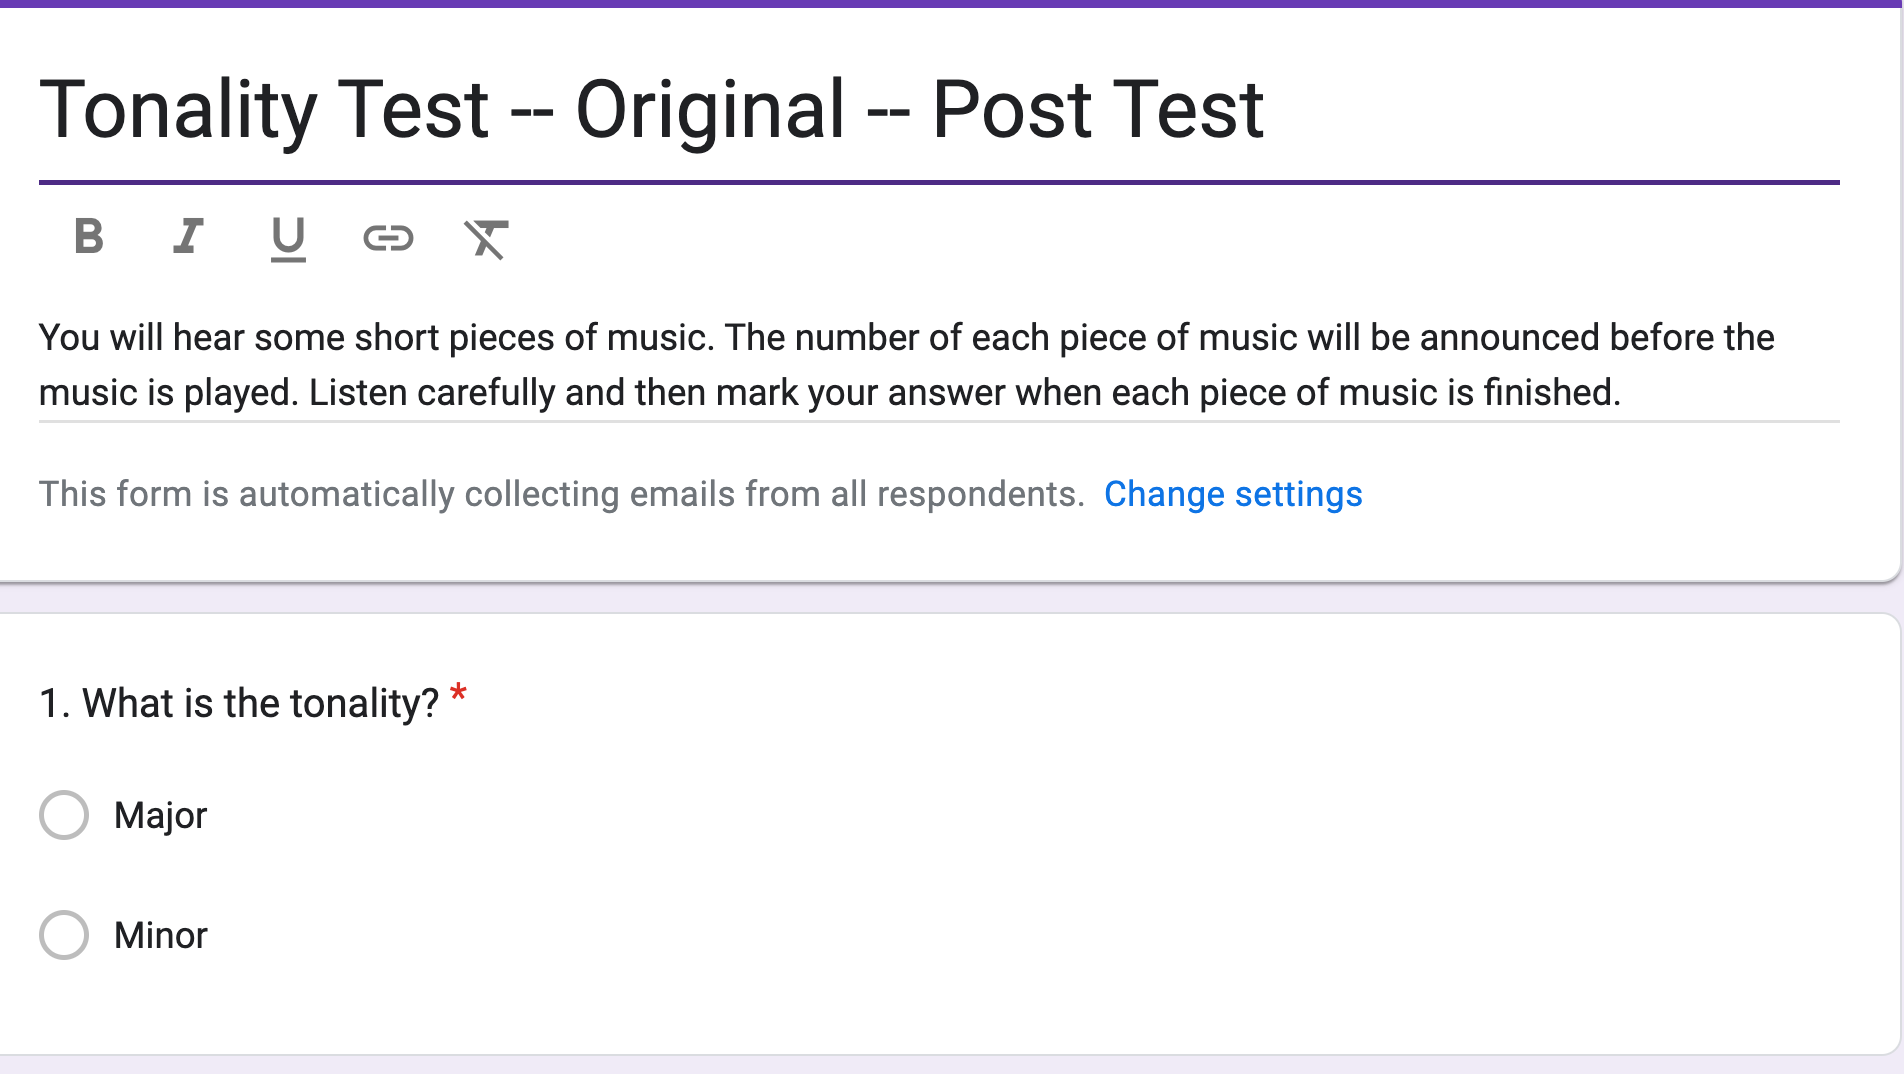
FIGURE 1. Sample of the google test form
The obtained post-test mean was 29.2, very close the theoretical mean of 30. The obtained standard deviation was 4.57, greater than its theoretical counterpart (3.33). These numbers tell me that the original 40-item test was a bit too hard for its intended population (upper elementary students): too many kids scored between the chance score of 20 and the theoretical mean of 30; and not enough kids scored between 30 and 40 (the highest possible score).
In Figure 2, you’ll see information about each test item: the item’s number, name, difficulty level, discrimination value, tonality, and genre. Very easy items (those with difficulty levels of 90% or higher) are highlighted in blue; very difficult items (those with difficulty levels below 60% are highlighted in red).
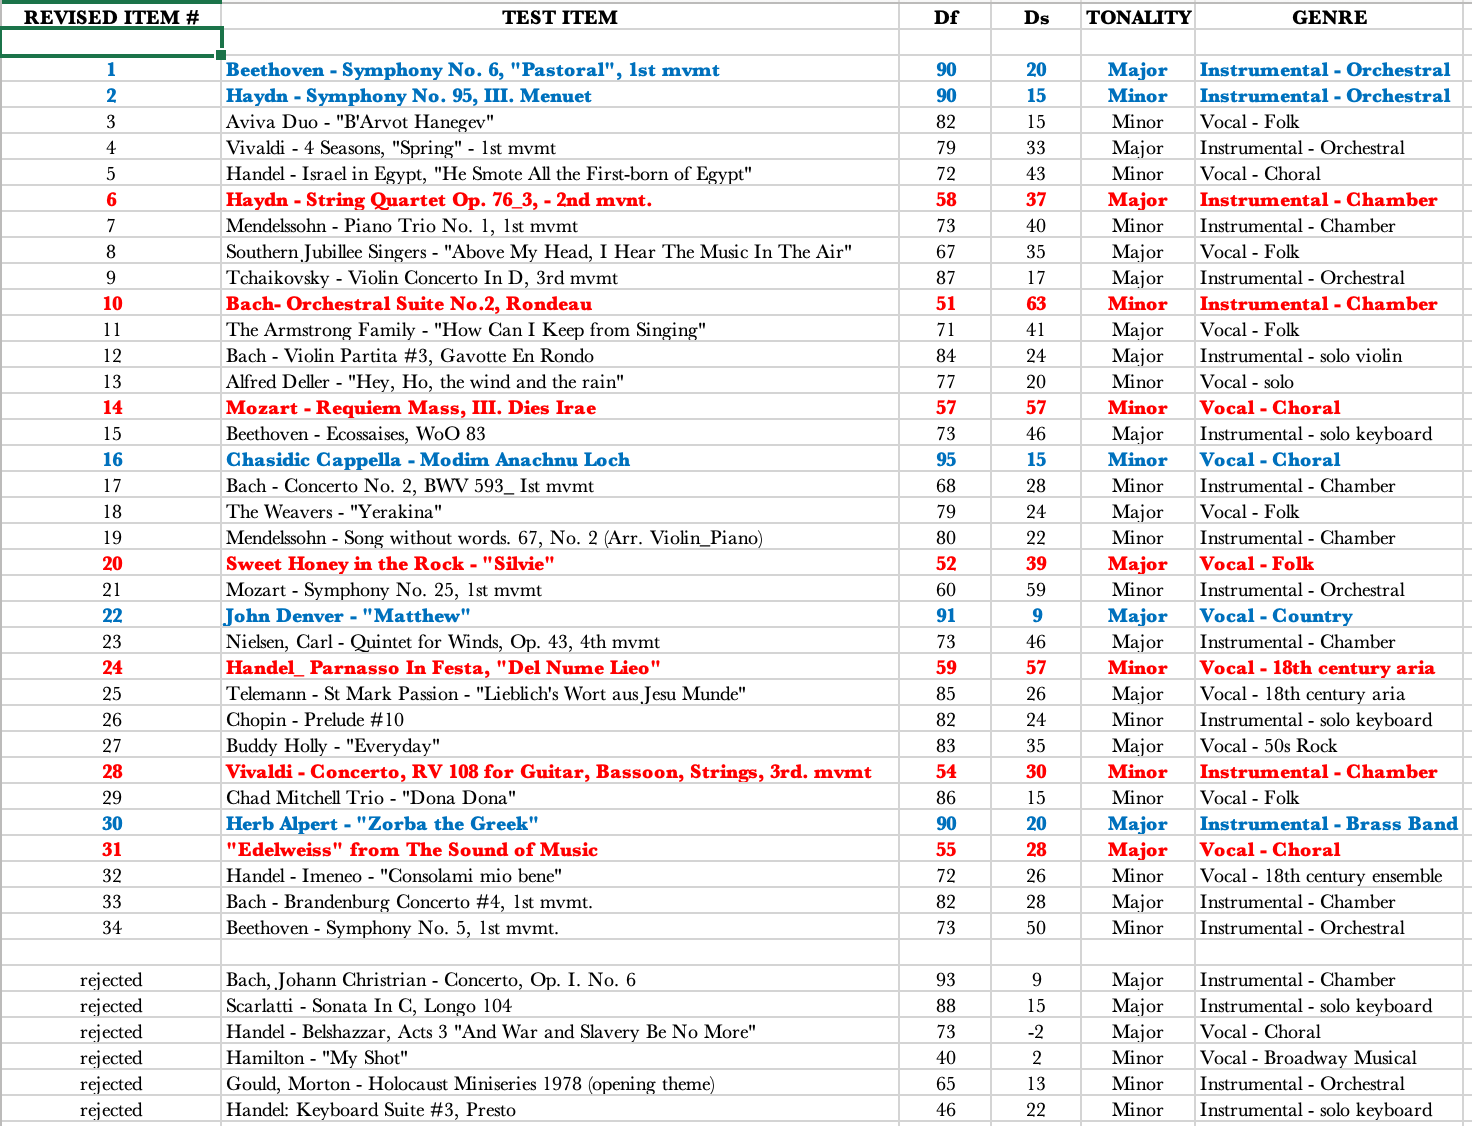
FIGURE 2: Information about each item.
_________________________________________________________________________________________
Item Analysis: A Brief Tutorial
My two goals: shorten the test and simplify it. A handy way to kill those two birds with one stone is to eliminate some of the very difficult items.
If you look at the top row in Figure 2, you’ll see the initials Df and Ds. They stand for Item Difficulty and Item Discrimination. Let me give you a brief tutorial about what these terms mean and how I calculated the numbers in each column.
After students submitted their answers, I ordered their scores from lowest to highest; then I separated the lowest 27 percent and the highest 27 percent, a practice recommended by Robert Ebel in his book Measuring Educational Achievement (1965). Twenty-seven percent of 172 is 46.4. In other words, I made use of 46 of the lowest google forms and 46 of the highest google forms, giving me 92 google forms in all to play with.
To calculate item difficulty, I did the following:
I added the number of correct responses from the lowest 27% to the number of correct responses from the highest 27%. Then I divided that sum by the total number of google forms, in this case, 92.
The equation looks like this:

Let me show you how this works in real life. As an example, I’ll use a rejected item, Johann Christian Bach’s Concerto, Op. I. No. 6. In the high scoring group, 45 students answered the item correctly; in the low scoring group, 41 students answered the item correctly. I added 45 to 41, got 86; then I divided 86 by 92, the total number of google forms I investigated. The result was .93, meaning that the J. C. Bach excerpt is a very easy test item.
With the numbers plugged in, the equation looks like this:

Calculating item discrimination was a bit trickier. First, I subtracted the low scorers who got it right (41) from the high scorers who got it right (45), and then divided that number (4) by half the number of test papers I’m working with (46). The result is .09, which means Item #1, though it’s a positively discriminating item, doesn’t show a clear distinction between the high and low achievers.
The equation looks like this:

With the number plugged in, the equation looks like this:

Some readers may catch that the formulas I use to calculate difficulty and discrimination are slightly different from those recommended by Gordon (2012) and Walters (2010), my esteemed professors at Temple University. They don’t follow the 27% rule. According to Ebel (1965), 27% is the best compromise between two contradictory ideals: You want the high scorers and low scorers to represent the sample as a whole; but you also want the two subgroups to be as different from each other as possible. If I were to use only small groups of low and high scorers, the number of test forms might be too small to represent the sample as a whole; if, on the other hand, I use all the test forms — the top and bottom 50% — the high and low scoring groups would not differ enough to offer up revealing data. The Goldilocks ideal, according to Ebel (1965, p. 349), is the top and bottom 27% because it “provides the best compromise between two desirable but inconsistent outcomes: 1) to make the extreme groups as large as possible, and 2) to make the extreme groups as different as possible.”1
Anyway, item discrimination basically works like this: If most of the high scoring kids get an item right, while most low scoring students get it wrong, that’s a good thing. It means the test item is doing what it’s supposed to do — draw a line between those students who “get” tonality and those who don’t. On the other hand, if most of the high scoring students get an item wrong, while most of the low scoring kids get that same item right, that spells trouble: The test item is not doing one of its main jobs, which is to differentiate between high and low achievers.
I decided ahead of time that if test items fall in the range of difficulty from 50 percent to 90 percent, I will retain them. If they fall outside that range, I’ll discard them (or at least most of them). And I wanted only positively discriminating items with a value of at least .20, with most of the items greater than .40.
_________________________________________________________________________________________
If you look at the bottom of Figure 2, you’ll see the 6 items I removed from the revised version of the test. I suppose I could have kept the J.C.Bach Concerto item, and I might have (despite its low discrimination value) if I had another easy instrumental chamber example in minor. But no such luck. Let me say that items on the extreme ends of difficulty (very easy or very hard) often have low discrimination values.
TO BE CONTINUED…
_________________________________________________________________________________________
Tonality Test – 1st Revision
- Beethoven – Symphony No. 6, Pastoral, 1st mvmt
2. Haydn – Symphony No. 95, III. Menuet
3. Aviva Duo – B’Arvot Hanegev
4. Vivaldi – Four Seasons, “Spring” – 1st mvmt
5. Handel – Israel in Egypt, He Smote All the First-born of Egypt
6. Haydn – String Quartet Op. 76_3, – 2nd mvnt.
7. Mendelssohn – Piano Trio No. 1, Op. 49 Ist mvmt
8. Southern Jubillee Singers – Above My Head, I Hear The Music In The Air
9. Tchaikovsky_ Violin Concerto In D, 3rd mvmt
10. Bach- Orchestral Suite No.2, Rondeau
11. The Armstrong Family – How Can I Keep from Singing
12. Bach – Violin Partita #3, Gavotte En Rondo
13. Alfred Deller – Hey, Ho, The Wind and the Rain
14. Mozart – Requiem Mass, III. Dies Irae
15. Beethoven – Ecossaises, WoO 83
16. Chasidic Cappella – Modim Anachnu Loch
17. Bach – Concerto No. 2, BWV 593_ Ist mvmt
18. The Weavers – Yerakina
19. Mendelssohn – Song without words. 67, No. 2 (Arr. Violin_Piano)
20. Sweet Honey in the Rock – Silvie
21. Mozart – Symphony No. 25, 1st mvmt
22. John Denver – Matthew
23. Nielsen, Carl – Quintet for Winds, Op. 43, 4th mvmt
24. Handel_ Parnasso In Festa, Del Nume Lieo
25. Telemann – St Mark Passion, Lieblich’s Wort aus Jesu Munde
26. Chopin – Prelude #10 (performed by my piano teacher, Marian Filar)
27. Buddy Holly – Everyday
28. Vivaldi – Concerto, RV 108 for Guitar, Bassoon, and Strings, 3rd. mvmt
29. Chad Mitchell Trio – Dona Dona
30. Herb Alpert – Zorba the Greek
31. Edelweiss from The Sound of Music (Performed by members of the Vienna Boys Choir)
32. Handel – Imeneo – Consolami mio bene
33. Bach – Brandenburg Concerto #4, 1st mvmt.
34. Beethoven – Symphony No. 5, Ist mvmt.
_________________________________________________________________________________________
- To be fair, Ebel didn’t come up with the 27% rule. Truman L. Kelley first introduced it in his 1939 (!) article “The Selection of Upper and Lower Groups for the Validation of Test Items.” ↩︎
_________________________________________________________________________________________
Ebel, Robert L. 1965. Measuring Educational Achievement. Englewood Cliffs, New Jersey: Prentice Hall.
Gordon, Edwin. 2012. Learning Sequences in Music: Skill, Content, and Patterns. Chicago: GIA.
Kelley, T. L. 1939. “The selection of upper and lower groups for the validation of test items.” Journal of Educational Psychology, 30(1), 17–24
Walters, Darrel L. 2010. A concise guide to assessing skill and knowledge. Chicago: GIA.
